Each of
us
sees
color
differently.
 Download the free Color Blind Pal app to your phone or tablet.
Open the app, tap “inspecting color” to change it to “filtering colors,” then tap the  at the top of the screen.
If it is difficult for you to see the color differences in the pie chart below, under “color blindness type” select your form of color blindness and click the ← at the top of the screen. Point your camera at this pie chart to see the colors shifted making the colors easier to tell apart.
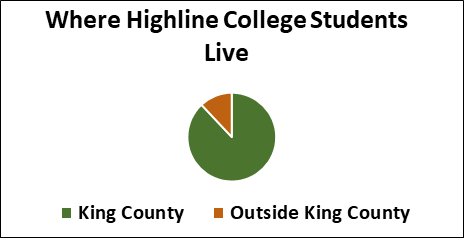
If you have typical color vision, under “color blindness type” select “simulate protanopia,” and click the ← at the top of the screen. Point your camera at the pie chart above to see what someone who cannot see red sees.*


* “Red? But the chart is green/orange…” Protanopia is absence of red and deuteranopia is absence of green. Our brain knows red and green are different by comparing them to each other. If one is missing, there is nothing to compare to, so they look the same.
