I was recently putting together a PowerPoint 2010 presentation that had a lot of charts in it. I wanted to reveal the data gradually, so I looked for a way to animate. It’s easy to do, if not entirely intuitive.
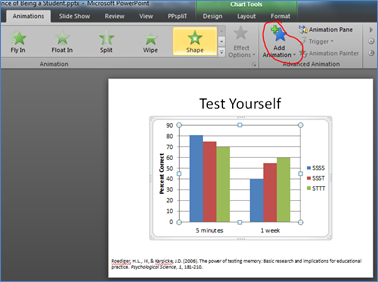
After creating the chart, switch to the “Animations” tab. Click on the chart to select it, then click the “Add Animation” button. Choose the animation style you like; I chose “fade”.
Now, with the chart still selected, click “Effect Options.”
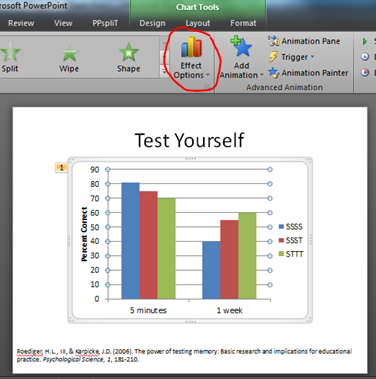
Here I can choose how I want the data to appear. When you mouse over each option, your chart will preview what it will look like as you step through your presentation. (Hats off to the PowerPoint 2010 team. I love this feature!)
In my sample chart, “By Series” will show the blue bars first, then the red, then the green. “By Category” will show all of the 5-minute bars first and then all of the 1-week bars. “By Element in Series” will show the 5-minute blue bar, then the 1-week blue bar, then the red bars in sequence, and finally the red bars in sequence. Lastly, “By Element in Category” will show the 5-minute blue bar, then the 5-minute red bar, then the 5-minute green bar, and this will repeat for the 1-week bars.
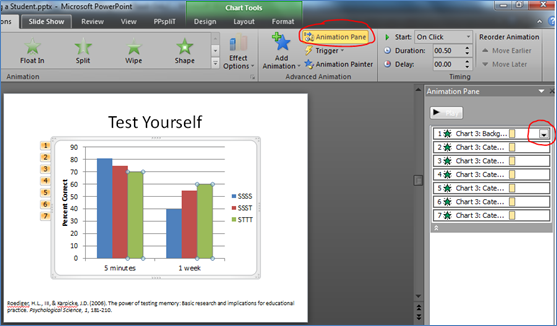
Click on “Animation Pane” to see the animations that were created. Click the down arrow next to the top animation in the animation pane to see all of the animations for the chart. The very first animation makes the chart itself appear. For my purposes, I wanted the chart already to be there when I advanced to this slide, so I clicked on the very top animation (“Chart 3: Background”) and hit delete on my keyboard. Done.
Side note
The data depicted on this slide comes from a nifty Roediger and Karpicke (2006) study. Participants in the study either had 4 opportunities to study a science passage (SSSS), 3 opportunities to study and 1 opportunity to do a free recall practice test of everything they remembered from the passage (SSST), or 1 opportunity to read the passage and 3 opportunities to do free recall practice tests (STTT). When they took the real test 5 minutes afterwards, the repeated study group remembered the most, but 1 week later, the practice test participants remembered quite a bit more. In psychology we call this the “testing effect” – the act of recalling information helps us remember it.
Roediger, H.L., III, & Karpicke, J.D. (2006). The power of testing memory: Basic research and implications for educational practice. Psychological Science, 1, 181-210.
